

Clinical trial feasibility and recruitment
How many SUS patients fit your protocol, and where they are.
Genius Cohort applies the study criteria to real SUS records and shows the eligible cohort, the arrival of new cases, the sites that treat these patients and the recruitment time, in minutes.
Real example: breast cancer treated with trastuzumab (HER2+), adults aged 18 to 75, SUS data.
Diagnoses, procedures, chemotherapy, specialized-component medications and hospitalizations from DataSUS, linked by patient.
Address, beds, accreditations and equipment of every health facility in the country.
More than 11,000 studies with sites in Brazil, with investigators and recruitment status, updated every week.
Aggregate counts only; any number below 10 shows as "< 10".
From protocol to recruitment plan
The images below come from the product itself, with a real search. Every number on screen comes from the search over SUS records; the AI helps build the protocol and interpret, but never invents numbers.
Build the protocol
From the protocol PDF to the criteria, no spreadsheet
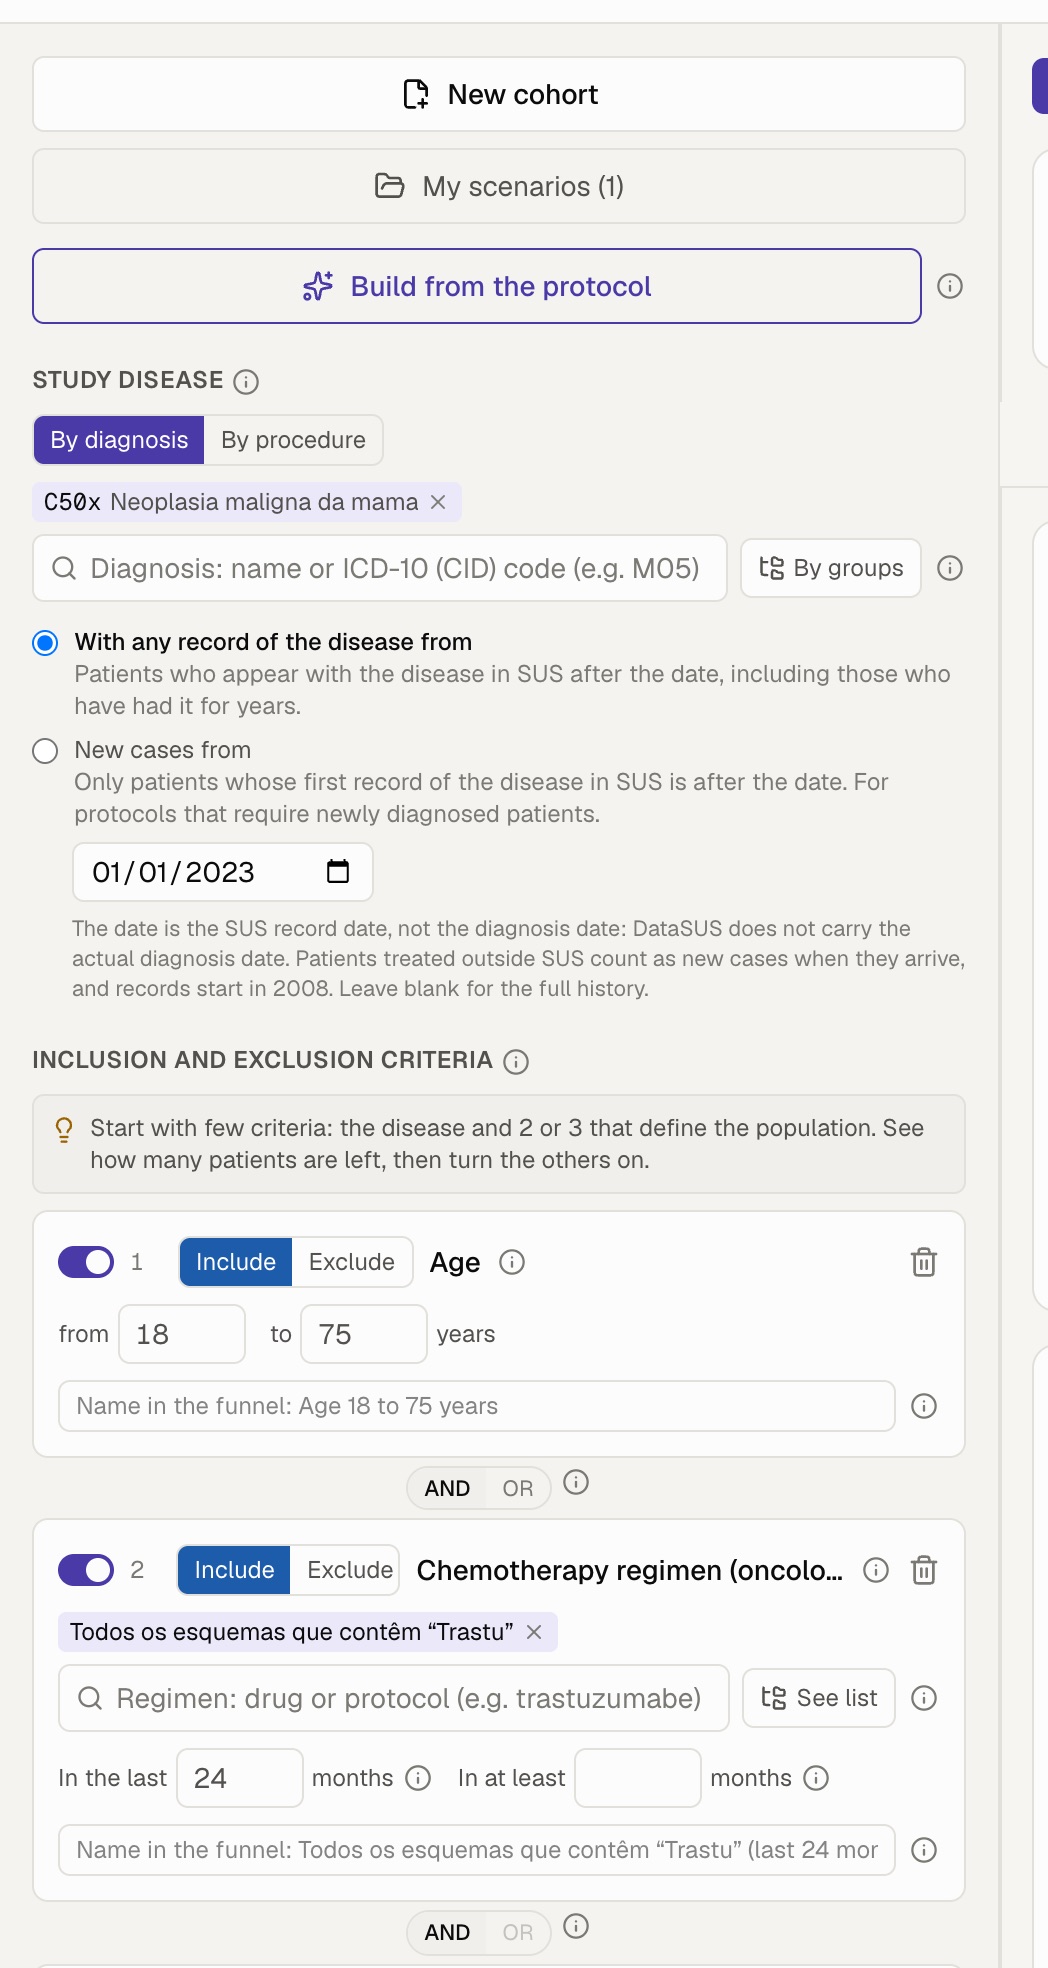
Upload the protocol in Word or PDF, or paste the eligibility criteria: the AI reads the text and proposes each criterion with the SUS codes. You review, switch on and off, and decide what goes in.
- Diagnoses (ICD-10), procedures and medications (SIGTAP), chemotherapy regimens, hospitalization, age, sex, recent SUS contact and death.
- Criteria combined with AND and OR, with time windows and a minimum number of treatment months.
- What DataSUS cannot assess (tests, scales, biomarkers) goes to a medical-record pre-screening checklist.
Protocol feasibility
See which criterion blocks recruitment
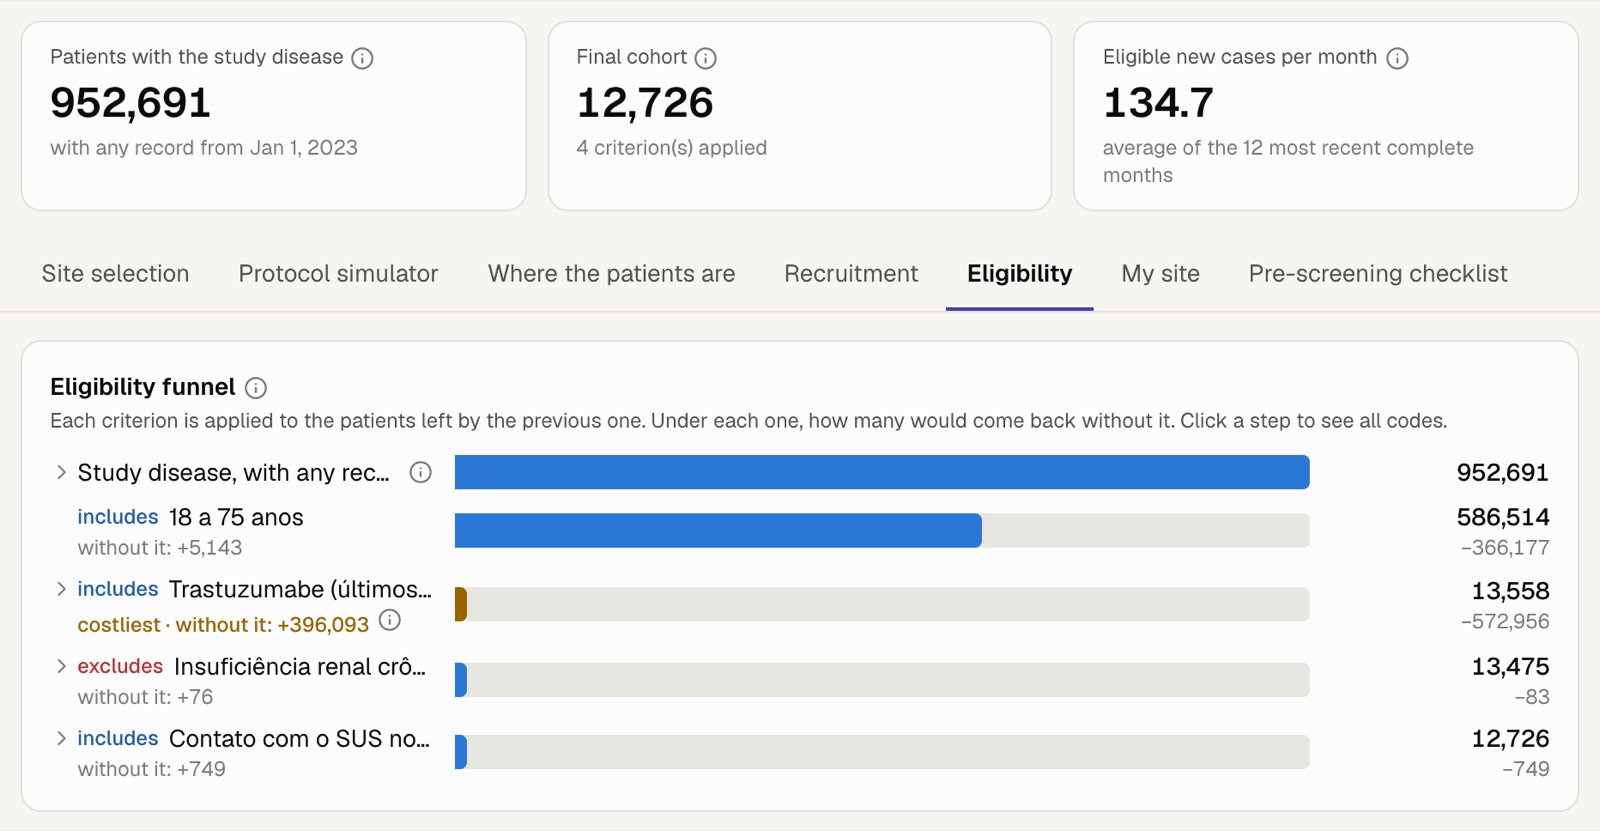
The funnel applies one criterion at a time and shows, for each, how many patients would come back without it. When the cohort falls below target, the system suggests what to remove; the simulator asks the AI for alternative criteria and measures each one with a real search.
- Patients with the disease, final cohort and eligible new cases per month.
- The most costly criterion is highlighted.
- Saved scenarios side by side to compare protocol versions.
Where the patients are
Who they are, where they live and where they are treated
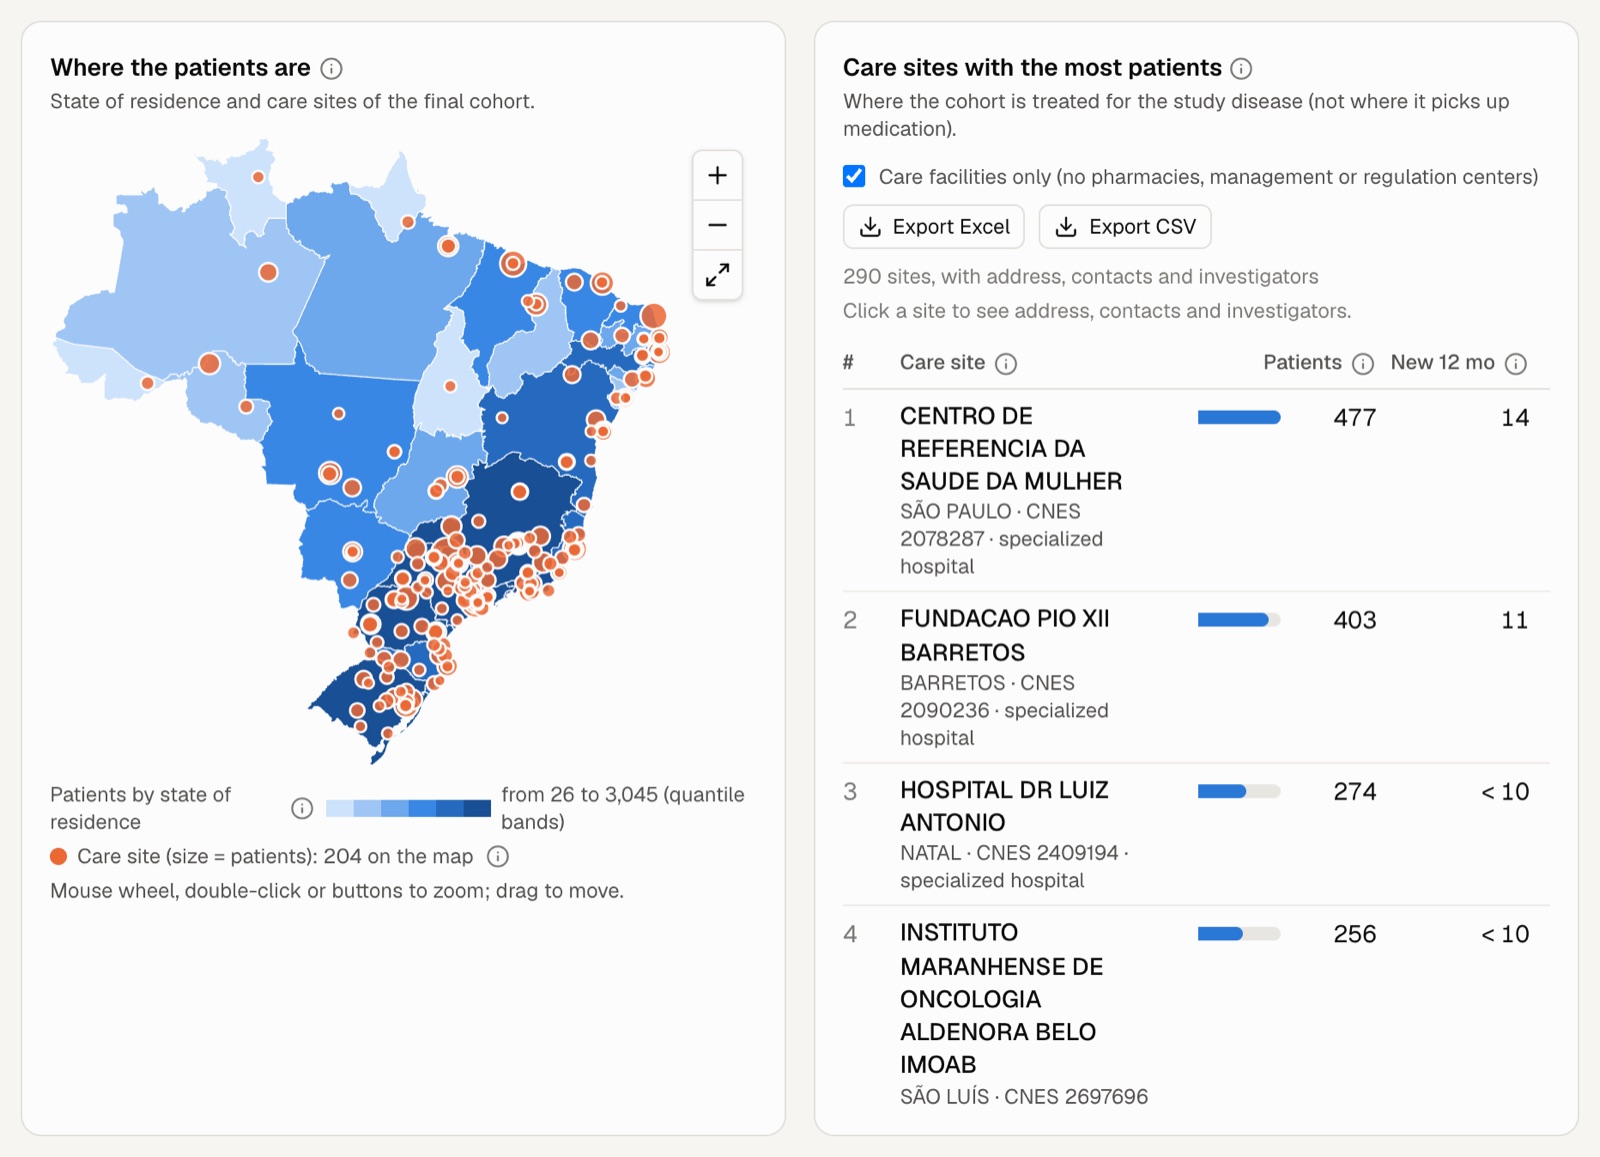
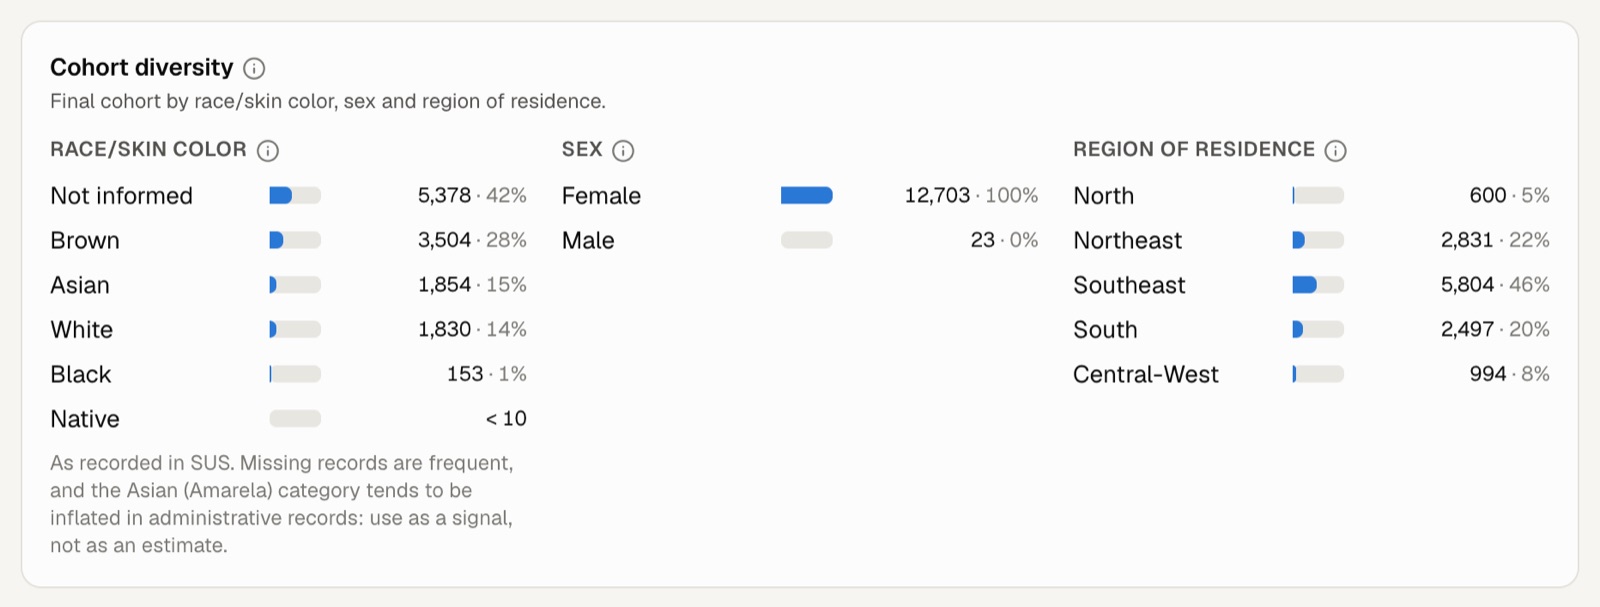
Cohort patients by state of residence and the SUS facilities where they are treated for the study disease, with the breakdown by race/skin color, sex and region to plan representativeness.
- Ranking of the sites with the most patients and new cases in the last 12 months.
- Map with zoom by region.
- Cohort diversity, as recorded in SUS.
Site selection
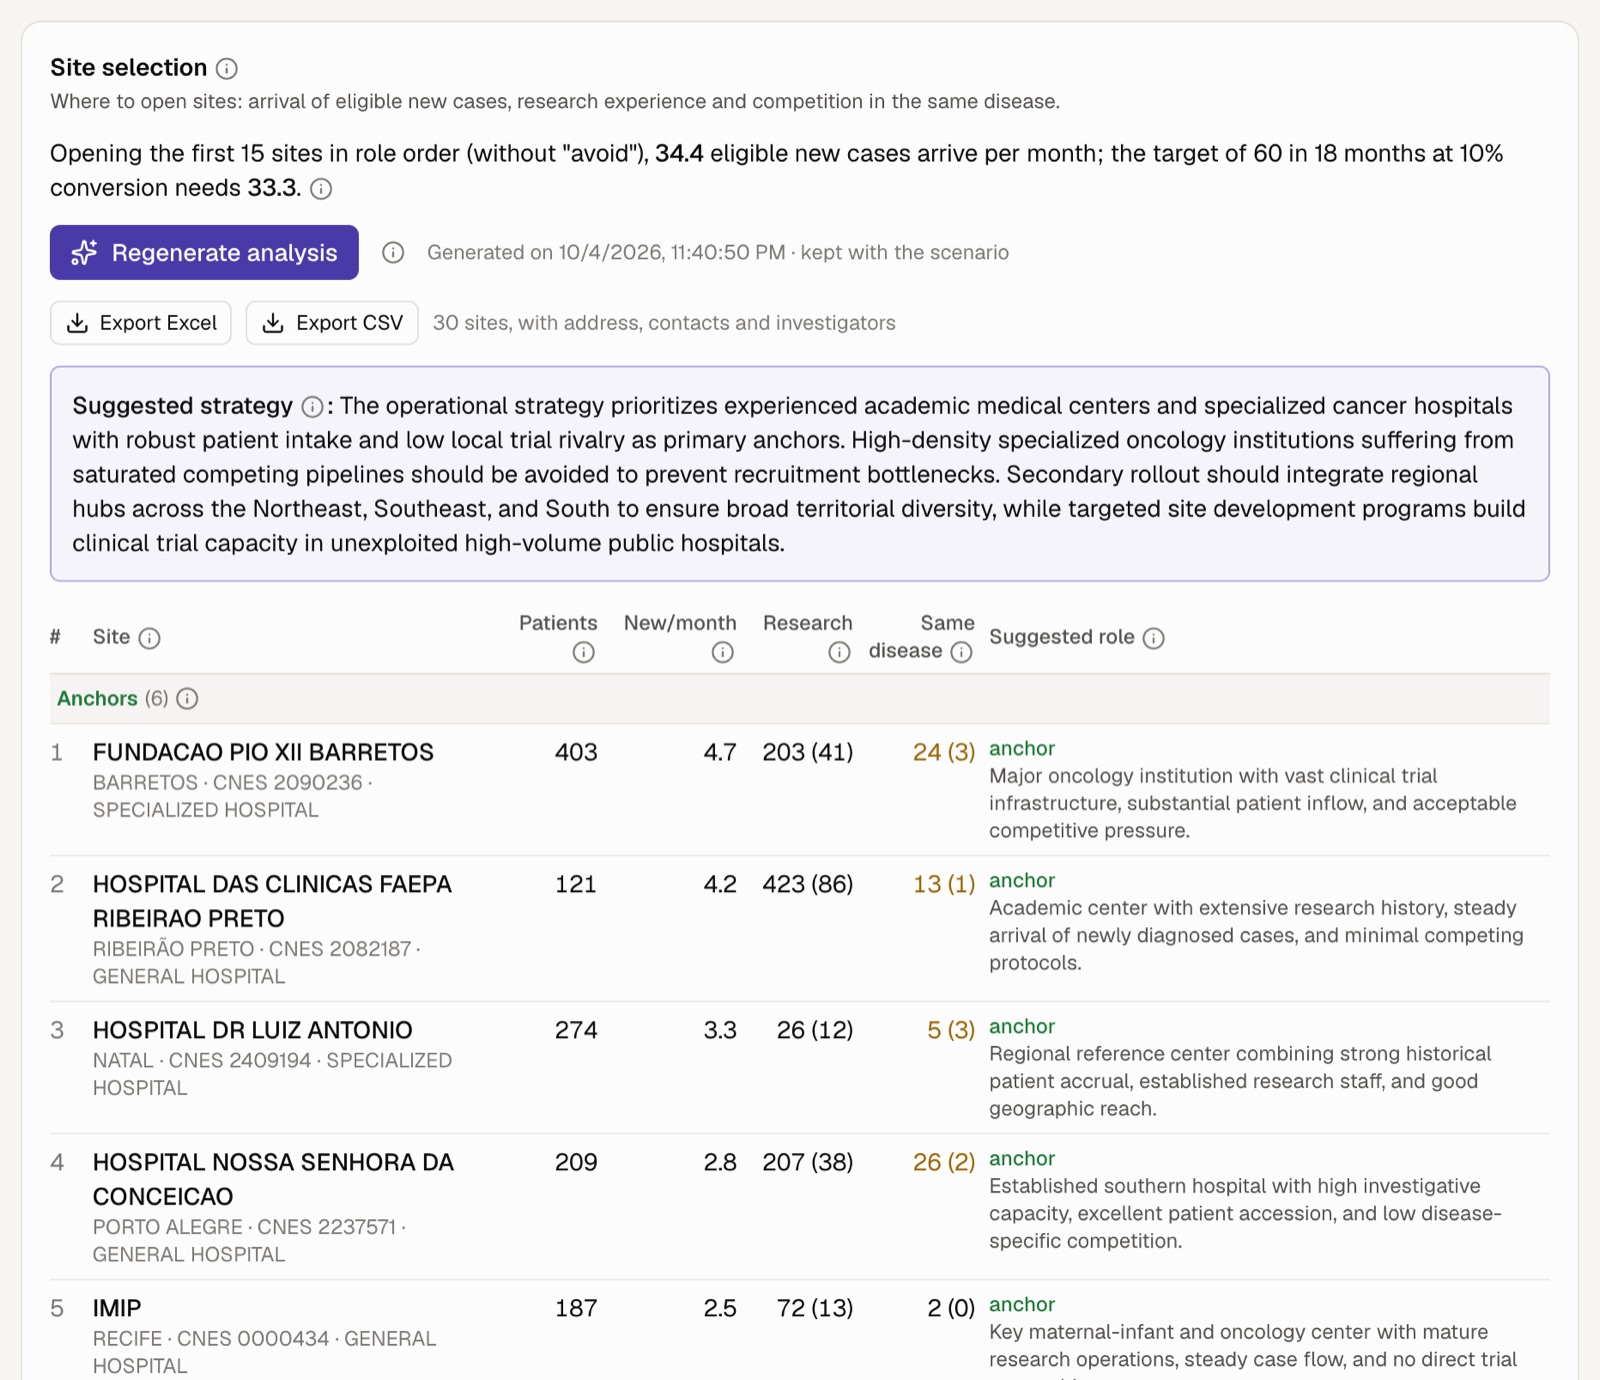
Which sites to open, and in what order
The sites with the most eligible new cases, with each one's clinical research experience and competition from studies recruiting the same disease. The AI suggests each site's role (anchor, complementary, to develop, avoid) and an activation strategy; the system calculates how many sites meet the target on time.
- Excel export with each site's address, contacts and investigators.
- Site profile with the investigators and the diseases of their studies.
- The AI writes the reasoning; the numbers come from the search.
My site
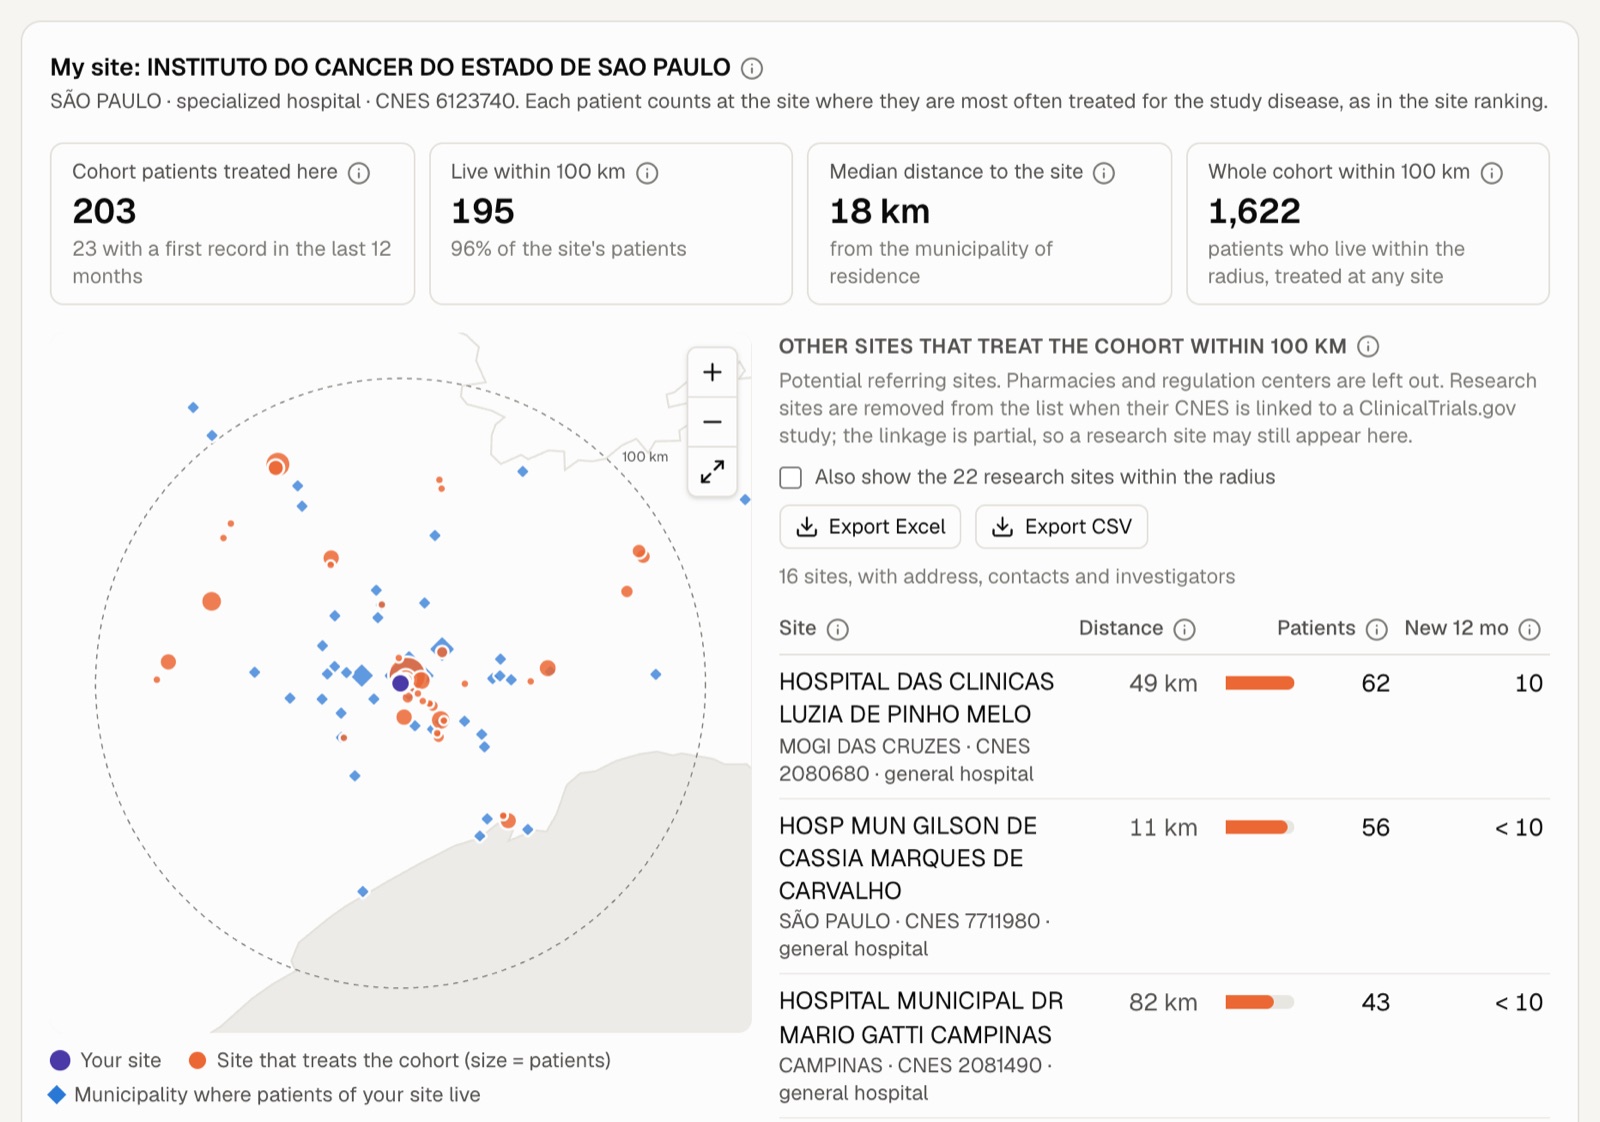
The research site sees its own patients and who can refer
How many cohort patients your site already treats, where they come from, the sites treating the same cohort within up to 300 km, the capacity registered in CNES and competing studies in the region.
- Patients treated, distance from where they live and the whole cohort within the radius.
- Referrers: other sites treating the cohort near you.
- The site's accreditations, beds and equipment.
Recruitment
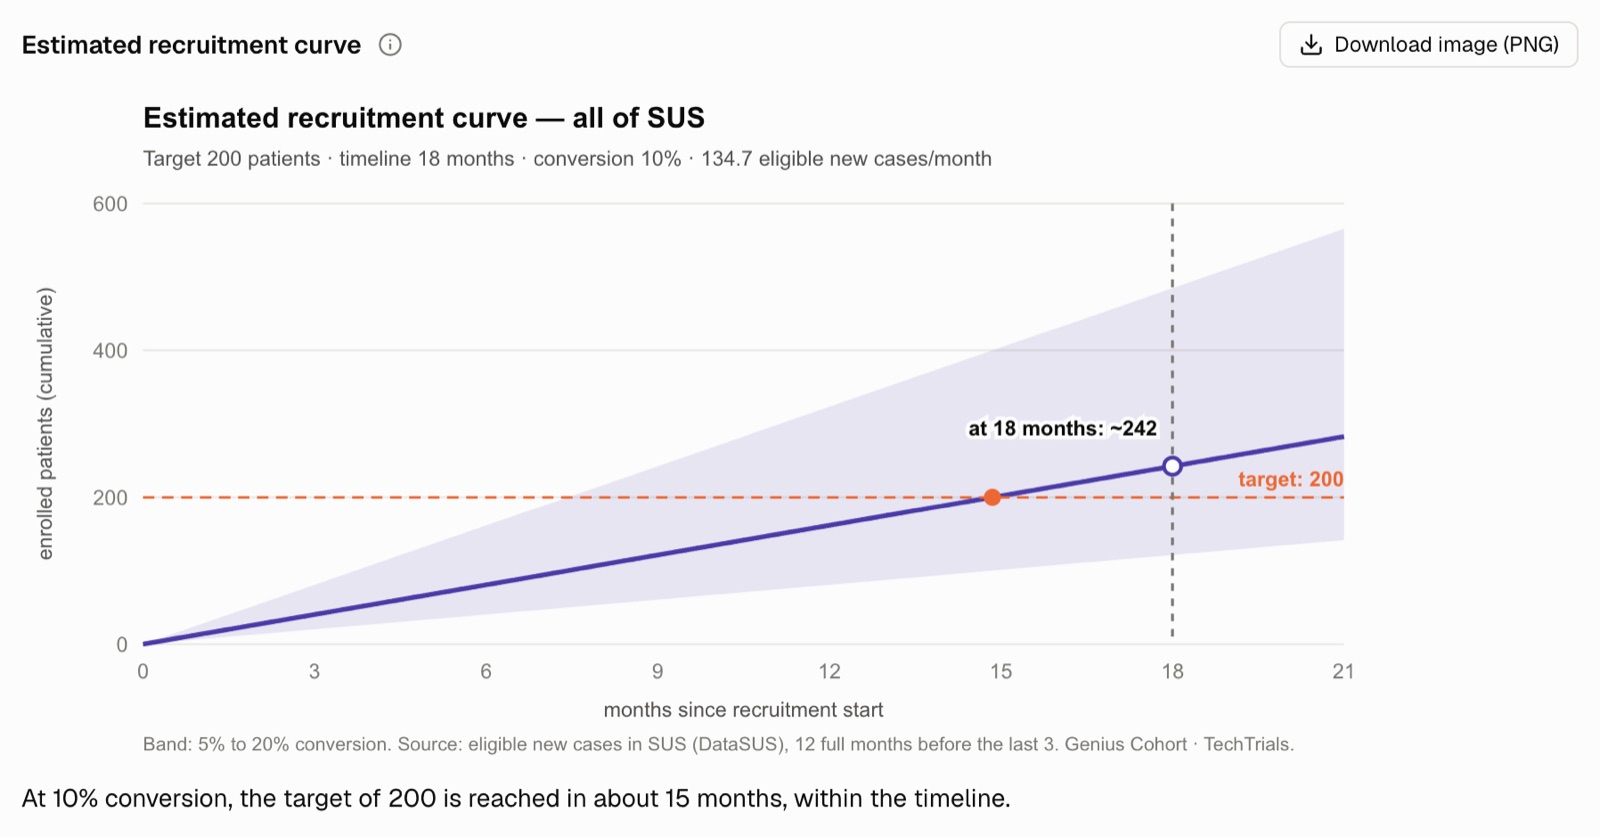
A recruitment curve to bring to the sponsor
With the target, timeline and conversion rate, Genius Cohort estimates the recruitment time and draws the curve of patients enrolled month by month, with the conversion uncertainty band. The image can be downloaded and goes into the PDF report.
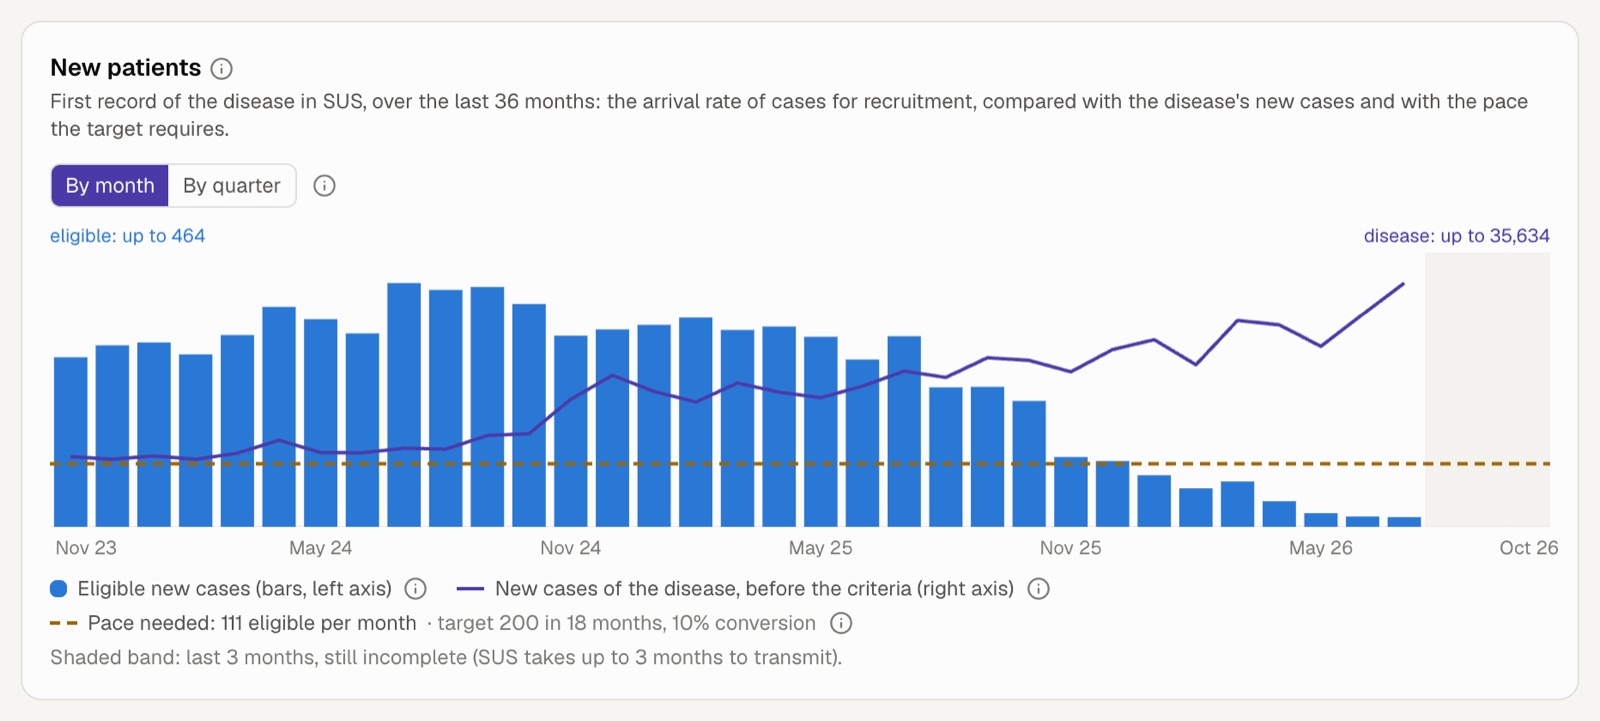
- New cases per month over the last 36 months, compared with the pace the target requires.
- Recruitment time at 5%, 10% and 20% conversion.
- For the whole of Brazil or just your site.
Real example: breast cancer treated with trastuzumab (HER2+), adults aged 18 to 75, SUS data.
One question for each role in research
Is this protocol feasible? Which criterion blocks recruitment?
Criterion-by-criterion eligibility funnel, how many patients each criterion costs, and a simulator that tests alternative protocol versions.
Where to open sites, and how many are needed?
Sites that treat the cohort, monthly arrival of new cases, research experience and competition on ClinicalTrials.gov, and how many sites meet the target on time.
Do I have patients for this study? Who can refer them?
How many protocol patients your site already treats, where they come from, who treats the same cohort nearby, the estimated recruitment curve and a pre-screening checklist for the medical record.
Frequently asked questions
How much does it cost?
For research sites, access is free, with a monthly usage limit enough to assess several studies a month. CROs and pharma have plans with higher limits and AI analyses at scale: talk to TechTrials.
Are patients identified?
No. The tool only shows aggregate counts (how many patients, where they live, where they are treated), and any number below 10 shows as "< 10". No patient data is displayed or exported.
Where does the data come from, and how recent is it?
From public SUS records (DataSUS: outpatient care, chemotherapy, medications and hospitalizations) since 2008, the facility registry (CNES) and ClinicalTrials.gov, updated every week. The most recent 3 months of outpatient data are still incomplete, because SUS takes up to 3 months to receive the records, and monthly-pace calculations leave them out.
What doesn't DataSUS show?
Test results, clinical scales, biomarkers and people treated only by private insurance. That is why Genius Cohort separates what the search confirms from what must be checked in the medical record, in a pre-screening checklist. A comorbidity only appears if it was coded: excluding by it gives a ceiling, including gives a floor.
Do I need to install anything?
No. It runs in the browser, in Portuguese and English, with the same TechTrials login as the other products.
Research sites
Free access for research sites
For people working at a clinical research site in Brazil. Enter your site's CNES: Genius Cohort uses it to show the patients you already treat.
The free plan has a monthly usage limit, enough to assess several studies a month.
CROs and pharma
Plans for CROs and sponsors
Protocol feasibility, site selection and recruitment planning at scale, with AI analyses and export of site lists with contacts and investigators. Leave your details and TechTrials will contact you.